
Plan and optimise quality
In the app: Planning → Quality Management (Overview · Cost of Quality) · Control → Quality control
PMP ECO · Process (41%) · Task Pr7. Decide what "good" means and how you'll measure it, pay for getting it right before paying for getting it wrong, and read the measurements well enough to tell a bad result from a bad process.
What it is
Quality management runs in three parts:
- Plan quality. Set the standards and the quality objectives: each with a metric, a target, how it's measured, how often, and who owns it.
- Manage quality (often called quality assurance). Turn the plan into how the work is done, and improve the process: method statements, training, trial runs, audits.
- Control quality. Measure the product against the targets: tests, inspections, control charts. The results feed back into managing quality.
Quality has a price, the cost of quality:
| Cost group | Examples | Found by | |
|---|---|---|---|
| Conformance | Prevention | Training, mix design, trial pours, better materials | |
| Appraisal | Testing, inspection, audits | ||
| Non-conformance | Internal failure | Rework, scrap, re-tests | The project |
| External failure | Rejections, warranty work, lost reputation | The customer |
Spending on conformance is how you avoid failure costs. There's a sensible balance: past a point, more testing doesn't pay for itself.
Two more distinctions the exam likes:
- Control limits vs specification limits. Specification limits come from the requirements: the customer's tolerance. Control limits are calculated from the process's own results: its natural variation. A process can be in control (stable, every point inside its control limits) and still not capable (its natural spread is wider than the spec allows).
- Quality vs grade. Quality is how well the product meets its requirements. Grade is the category of features. A low grade can be fine; low quality never is.
Why it matters
- Quality that isn't budgeted doesn't happen. A test the plan requires but no budget line pays for gets skipped when money is tight, usually just before handover.
- Failure costs more the later it's found. A cube test that fails costs a re-cast; a leaking facade found by the hotel's guests costs the brand.
- Fixing the result instead of the process repeats the failure. One weak pour re-cast is rework. A process that can't hold the spec will produce the next weak pour too.
Where you do it in VanillaPM
- Planning → Quality Management → Overview: the governed quality plan, the objectives (metric, target, method, frequency, owner), open defects, and the cost of quality with a warning if any planned quality work has no budget.
- Cost of Quality: every prevention, appraisal and failure cost, and what pays for it: a budget line, or an approved change (for example one paid from contingency, Pr6). Lines with nothing behind them are flagged, and you can assign them in place.
- Control → Quality control: the defect log, inspection results, and statistical quality control: for each measured characteristic, Cp/Cpk and an individuals chart with both control limits and spec limits, plus a plain-language verdict.
- The integrated plan (Pr1) checks Quality is costed in the budget.
Free tools: Quality management plan template (Word, Markdown) · Cp / Cpk calculator · Cost of quality calculator.
Walked example — Coral Ridge Resort
Four objectives cover what matters on a coastal hotel: concrete strength, cover to the rebar against salt air, waterproofing (flood tests per zone), and room finish at handover. Each has an owner and a measurement routine.
The cost of quality is USD 1.06M, 2.4% of the work: USD 805,000 on getting it right and USD 255,000 on fixing what went wrong. The marine-grade rebar coating (CR-04) is prevention paid from contingency. The failures tie back to the other lessons: the basement re-grouting (Pr4), a re-cast column, and a cladding sample the brand rejected.
Two findings:
- The facade water testing isn't budgeted. The facade package is fixed price (Pr5), and its contract excludes site testing. The quality plan needs the USD 90,000 of tests; no budget line pays for them.
- The concrete process can't hold the spec. Sixteen pours, all inside the control limits, but pour 10 came in at 38 MPa, below the 40 MPa minimum. Cpk is 0.6. The re-cast fixed that column; it didn't fix the process.
The workspace — the theory behind each screen
Every screenshot is the actual sample project, not a mock-up.
1 · Objectives: what good means, and who checks it
The theory: plan quality management. Each quality requirement becomes a measurable objective: the metric, its target or tolerance, how it's measured, how often, and who is responsible. Without the measurement method and the owner, an objective is only a hope.
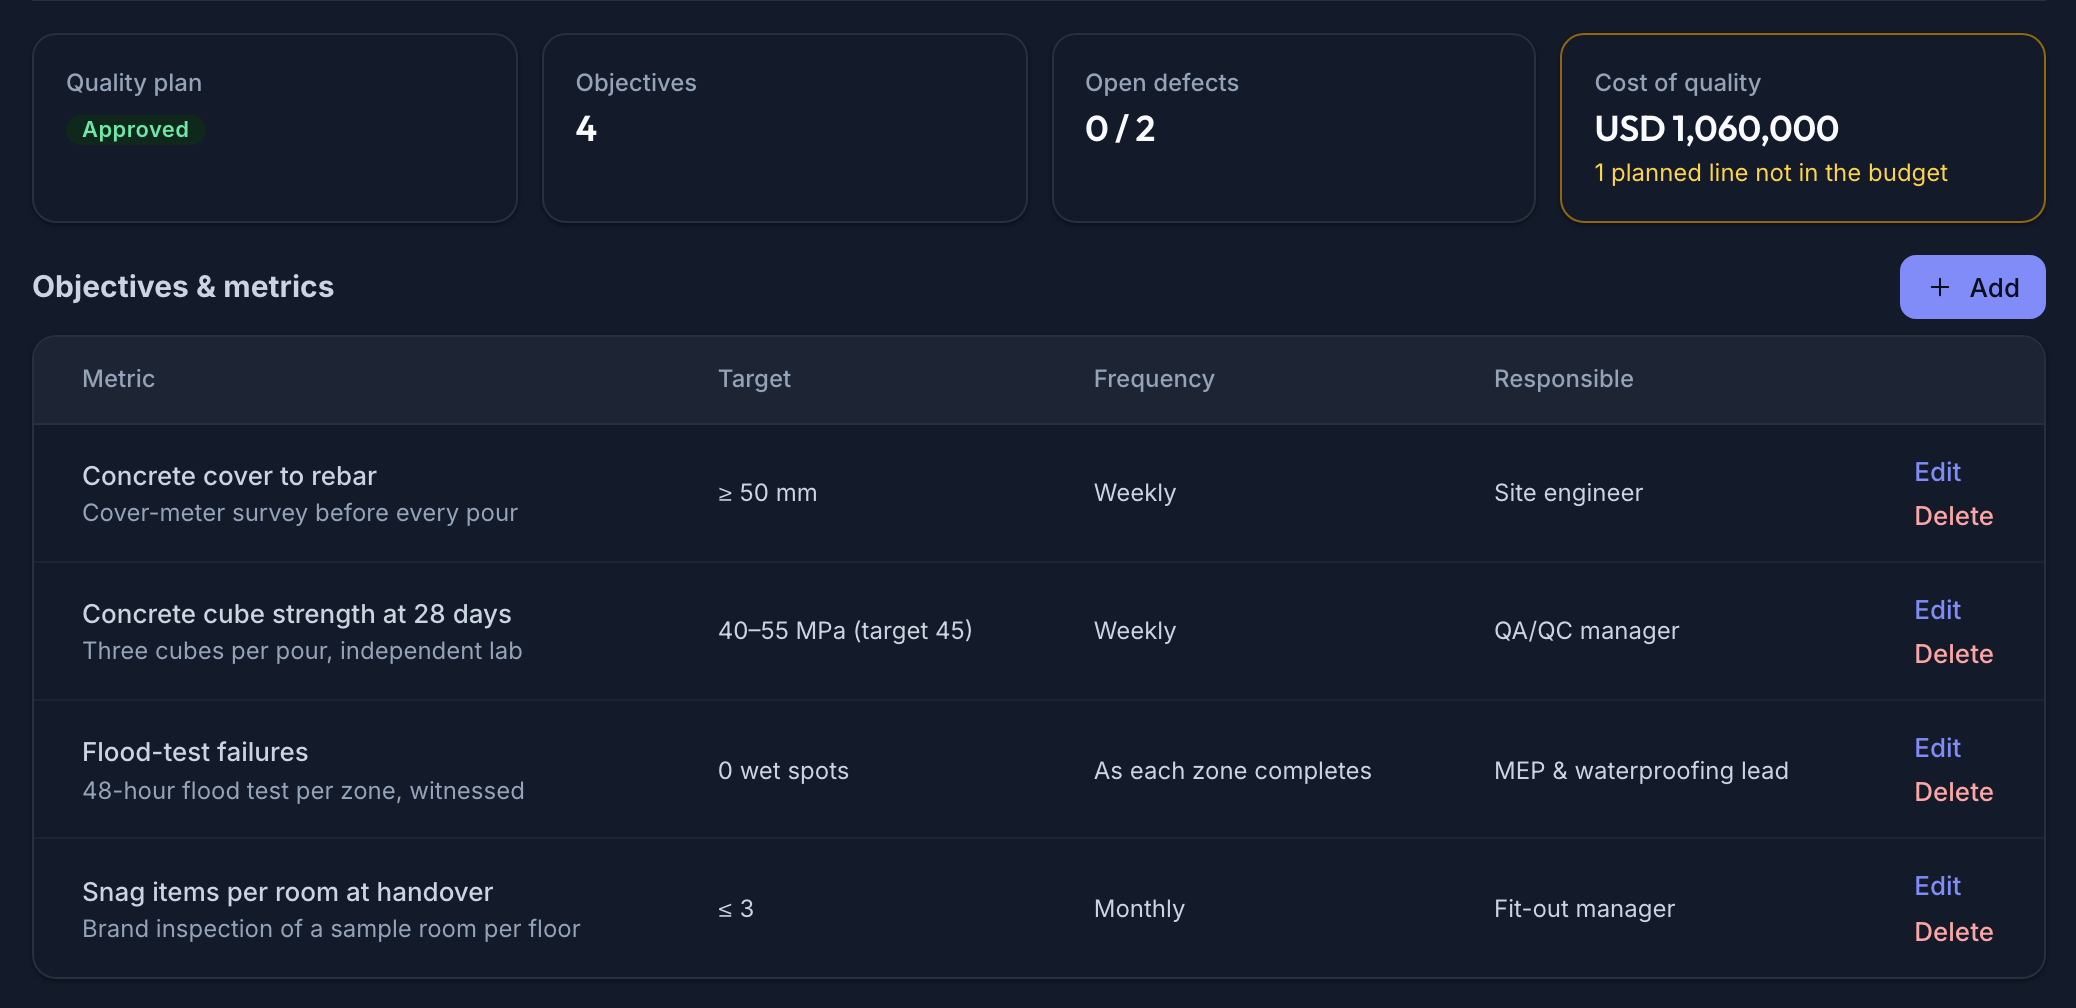
Reading the screenshot: the quality plan is Approved; 4 objectives; 0 / 2 defects open. Cost of quality USD 1,060,000, with an amber 1 planned line not in the budget. Each objective reads as a routine someone owns: Concrete cube strength at 28 days, 40–55 MPa (target 45), three cubes per pour, independent lab, weekly, QA/QC manager.
✅ Do give every objective a method, a frequency and an owner.
❌ Avoid objectives like "high quality finishes". If nobody can measure it, nobody can manage it.
2 · Cost of quality: paying to get it right, and where the money is
The theory: cost of quality. Conformance costs (prevention and appraisal) are spent to avoid non-conformance costs (internal and external failure). Conformance work belongs in the cost baseline like any other work.
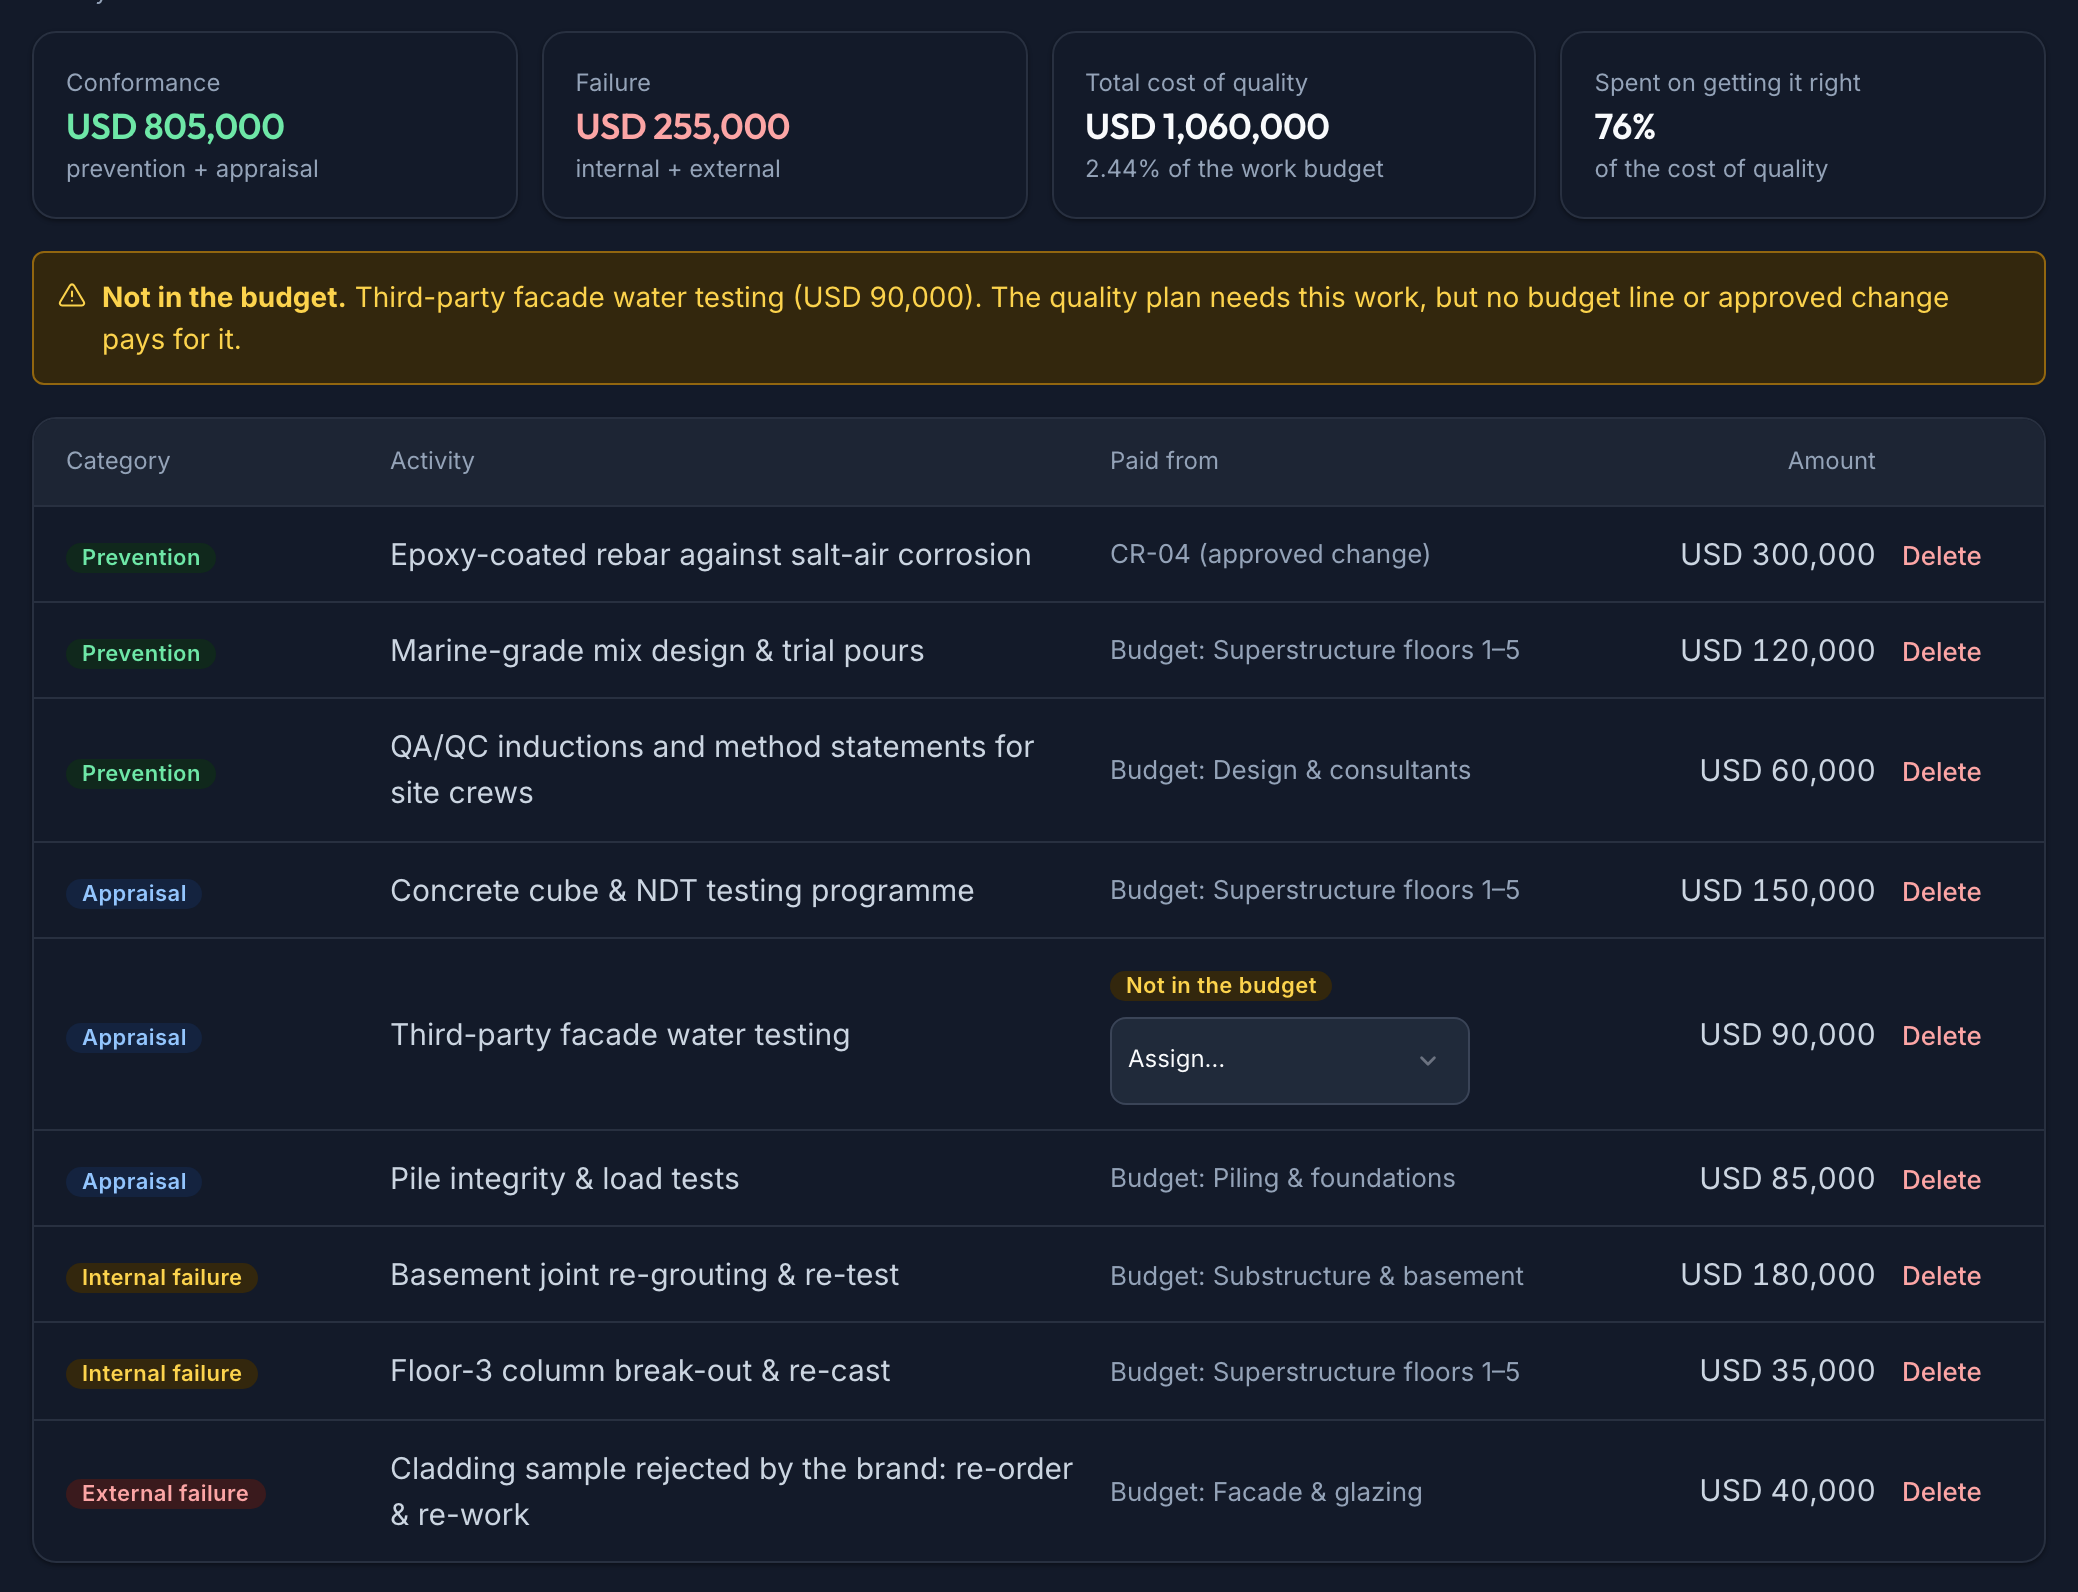
Reading the screenshot: conformance USD 805,000, failure USD 255,000, total USD 1,060,000 (2.44% of the work budget), 76% spent on getting it right. Every line says what pays for it: Epoxy-coated rebar, CR-04 (approved change); Concrete cube & NDT testing, the superstructure budget. Third-party facade water testing: Not in the budget. The amber banner says the same: the quality plan needs this work, but nothing pays for it. The fix is a decision: add it to the facade budget line or fund it from contingency. Either way, it goes on the record.
✅ Do link every prevention and appraisal activity to the budget line that pays for it.
❌ Avoid assuming a fixed-price contract includes the testing. Read its scope.
3 · In control but not capable
The theory: control quality, with control charts. Control limits (calculated from the process) show whether it's stable. Specification limits (from the requirements) show what's acceptable. Capability (Cp, Cpk ≥ 1.33 is the usual aim) shows whether a stable process fits inside the spec. A point outside the control limits means an assignable cause: find it. A stable process that still misses the spec means the process itself must change.
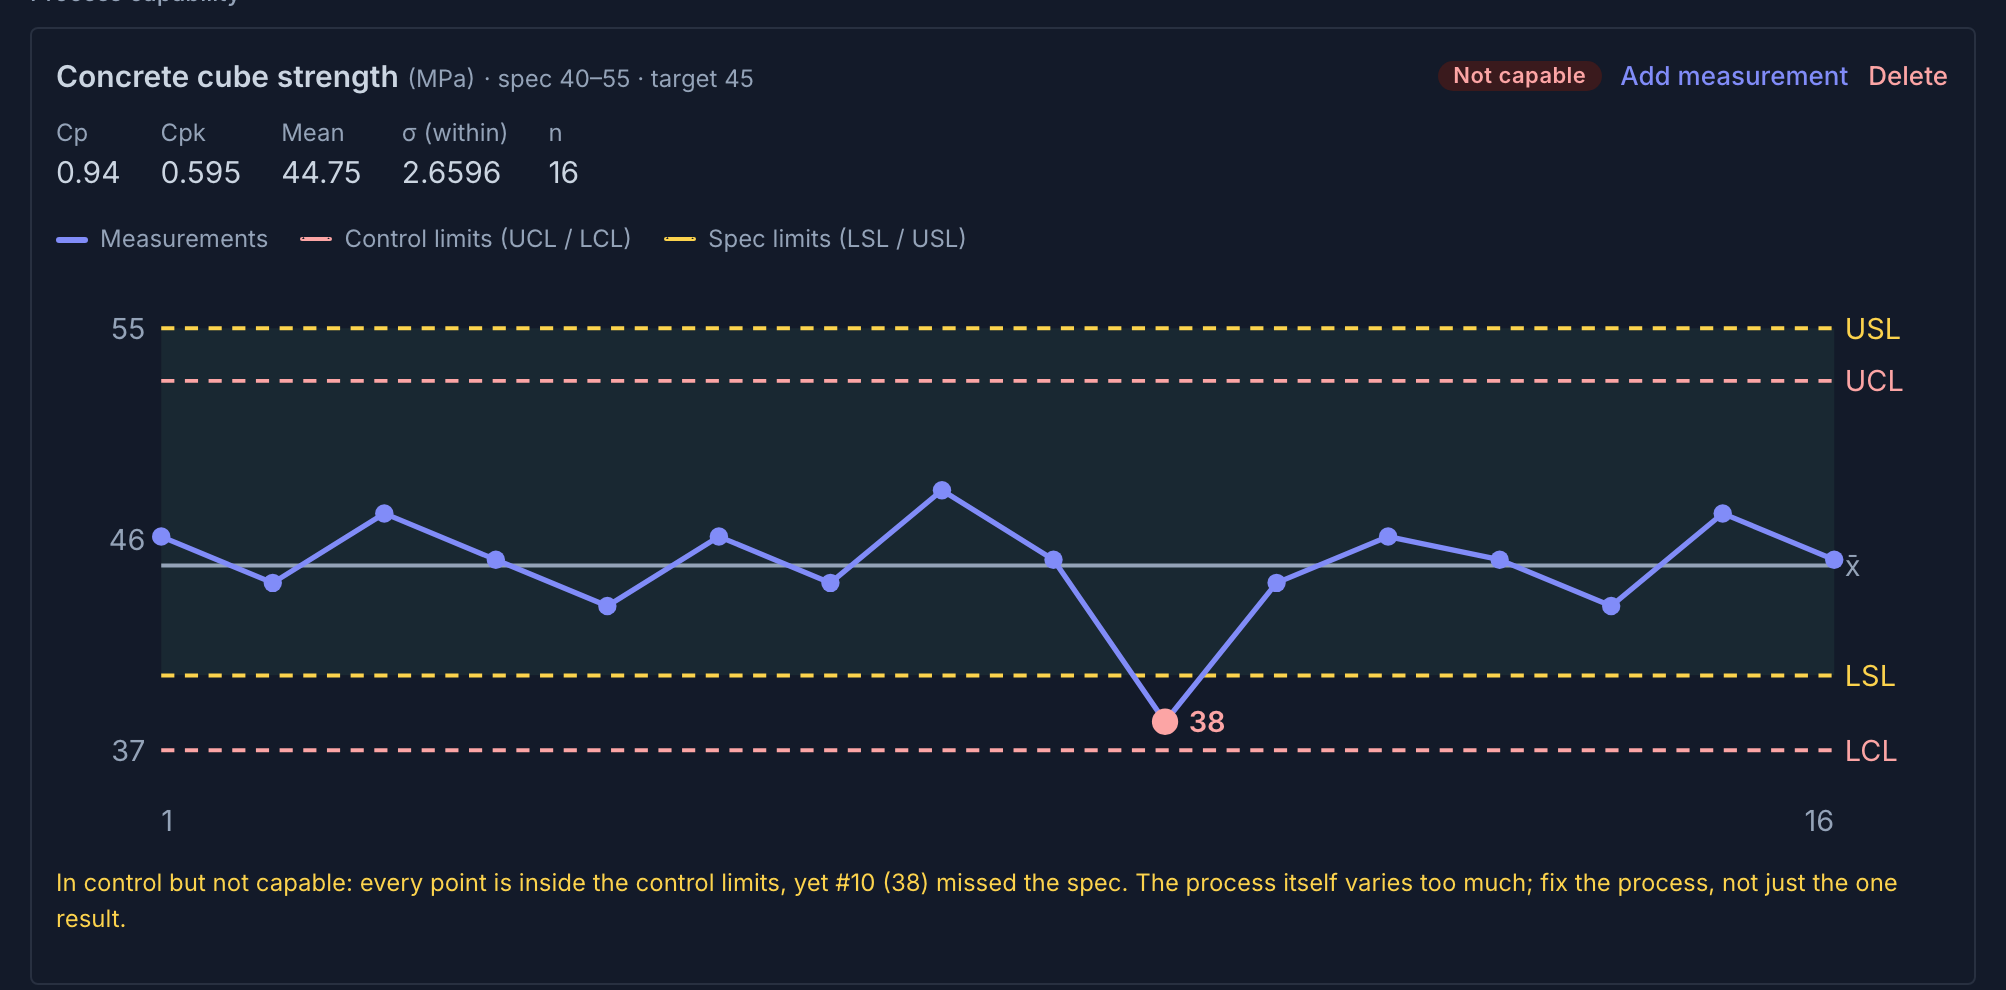
Reading the screenshot: 16 pours, mean 44.75 MPa. The dashed red lines are the control limits (UCL, LCL); the dashed amber ones are the spec limits (40 and 55 MPa). Every point is inside the control limits, so the process is stable. But pour 10, 38 MPa, is below the spec, and Cpk 0.595 says it will happen again. Not capable. Re-casting the column was the right correction; the lasting fix is the process: the mix and the curing of afternoon pours in the heat.
✅ Do read the control limits and the spec limits separately; they answer different questions.
❌ Avoid treating a stable process as a good one. Stable can mean reliably out of spec.
Best practices & pitfalls
- Do plan quality in: objectives with owners, and the prevention and appraisal work they need, budgeted.
- Do separate manage quality (the process: assurance, audits, improvement) from control quality (the product: tests and inspections).
- Do act on capability, not just on individual failures.
- Pitfall: confusing grade with quality. A three-star finish can be high quality; a five-star finish can be low quality.
- Pitfall: cutting appraisal to save money. The saving comes back as failure cost, often external.
On the PMP exam
Know cost of quality: prevention + appraisal (conformance) versus internal + external failure (non-conformance), and that prevention is preferred to inspection. Know manage quality vs control quality (process vs product), grade vs quality, and control limits vs specification limits: a point outside the control limits, or a run of seven points on one side of the mean, signals an assignable cause. Know the basic quality tools: cause-and-effect diagrams, flowcharts, check sheets, Pareto diagrams, histograms, control charts and scatter diagrams. In scenarios, the PM finds the root cause and fixes the process, rather than only reworking the defect.