
Evaluate project status
In the app: Project → Control → Overview · Project → Control → Project history
PMP ECO · Process (41%) · Task Pr9. Measure where the project actually is against the baselines, forecast where it's heading, and report it so decisions can be made.
What it is
Evaluating status is the monitoring & controlling heartbeat: collect work performance data, turn it into information (variance and trend analysis, usually via Earned Value), and package it as reports for each audience. The point isn't the report — it's the forecast and the decision it enables: are we on track, and if not, what do we do?
Why it matters
- Status without a baseline is an opinion. Against a baseline, EVM turns "feels behind" into "SPI 0.92, forecast six weeks late" — actionable.
- Early, honest forecasting buys time to respond while responses are still cheap.
Where you do it in VanillaPM
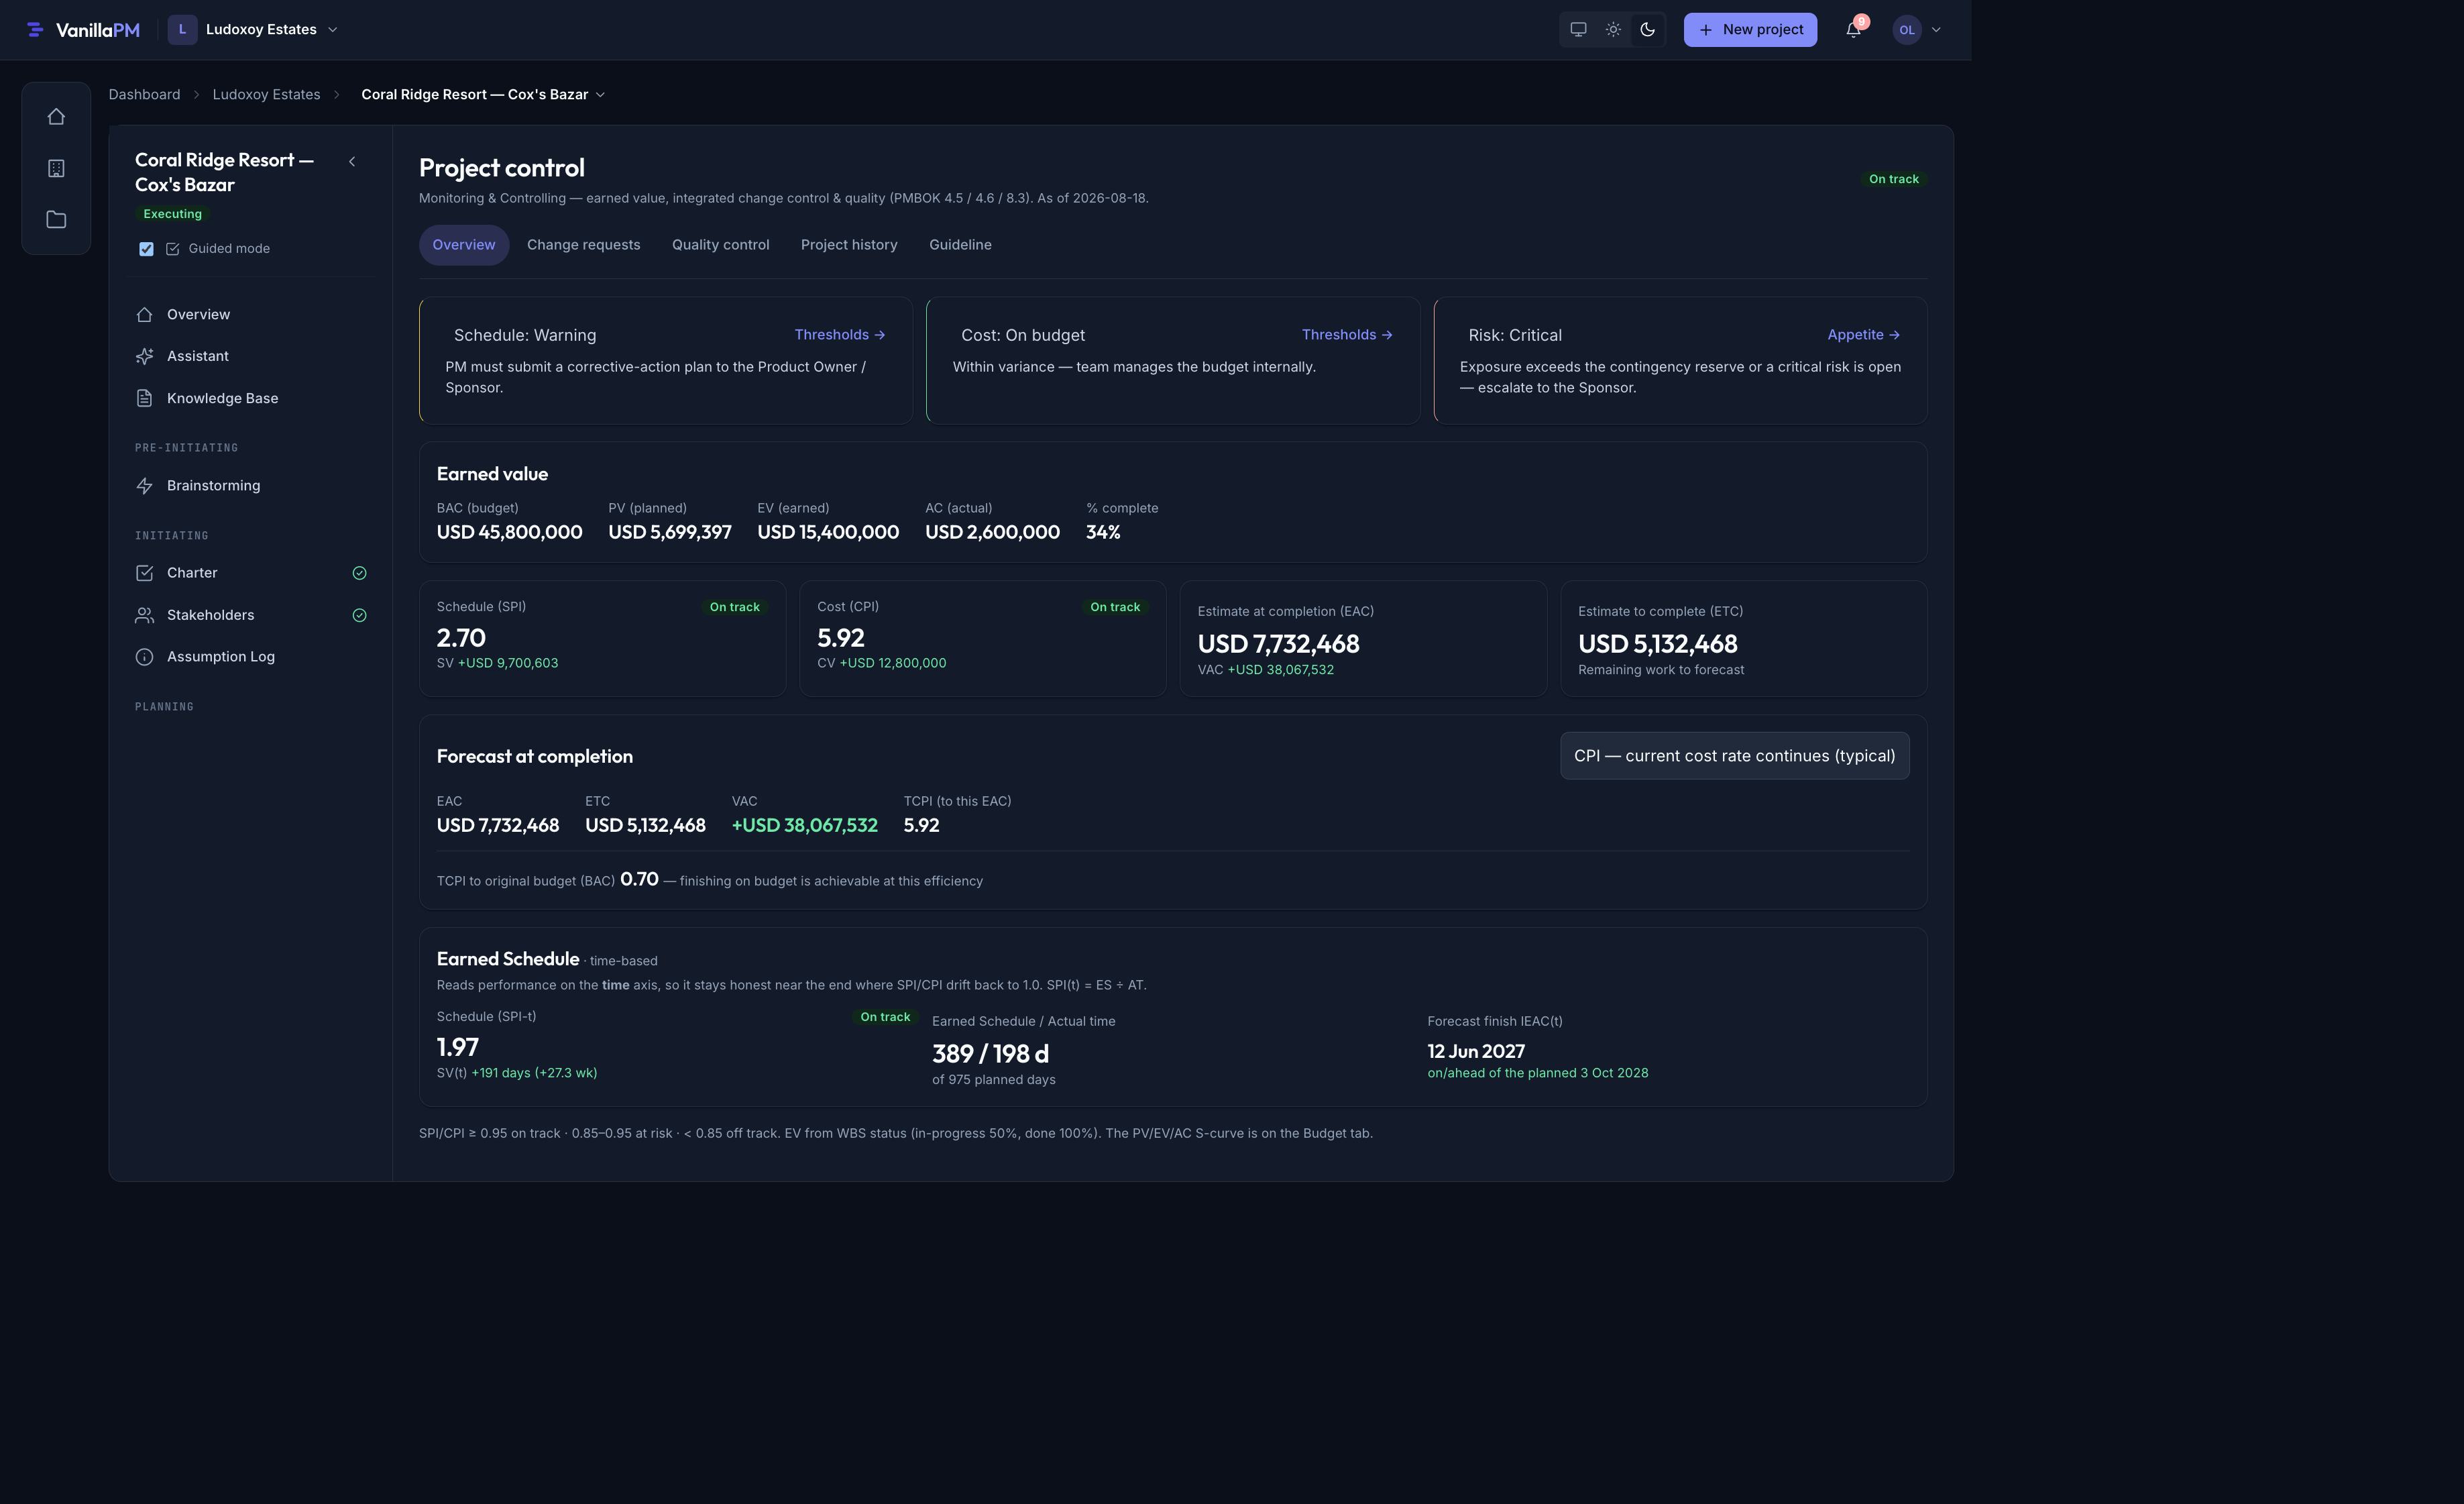
The Control workspace is the status hub. Earned Value + forecasting give the objective read (CPI/SPI, EAC) on Control → Overview; the activity feed on Control → Project history is the running record of what happened; BI reports (org level) aggregate cross-domain KPIs; and the artifact register shows what's been produced. Together they answer "status?" with evidence, not vibes.
Walked example — Coral Ridge Resort
Mid-superstructure, Coral Ridge's status is read from EVM: the monsoon pushed the frame, so SPI < 1 (behind schedule) while CPI holds near 1 (spend tracking the work earned). The forecast EAC and completion date update automatically, and the steering status report carries the top variances, the recovery plan (fast-tracking fit-out), and the live risks. The activity feed corroborates the story — pours completed, an inspection passed, a clearance condition closed.
The artefact
- Status / performance reports (with EVM forecast), plus the activity feed and artifact register that back them.
Best practices & pitfalls
- Do report against the baseline with EVM — trends beat snapshots.
- Do tailor the report to the audience (investor dashboard vs regulator evidence — see P8).
- Pitfall: "watermelon" reporting — green on the outside, red inside. Forecast honestly; the variance you hide is the one that ambushes you.
On the PMP exam
This is monitoring & controlling and reads heavily on EVM interpretation and forecasting (EAC methods, variance/trend analysis). Know that data → information → report, and that the value of status is the decision it drives — the best answers analyse the variance and act, not just circulate a report.